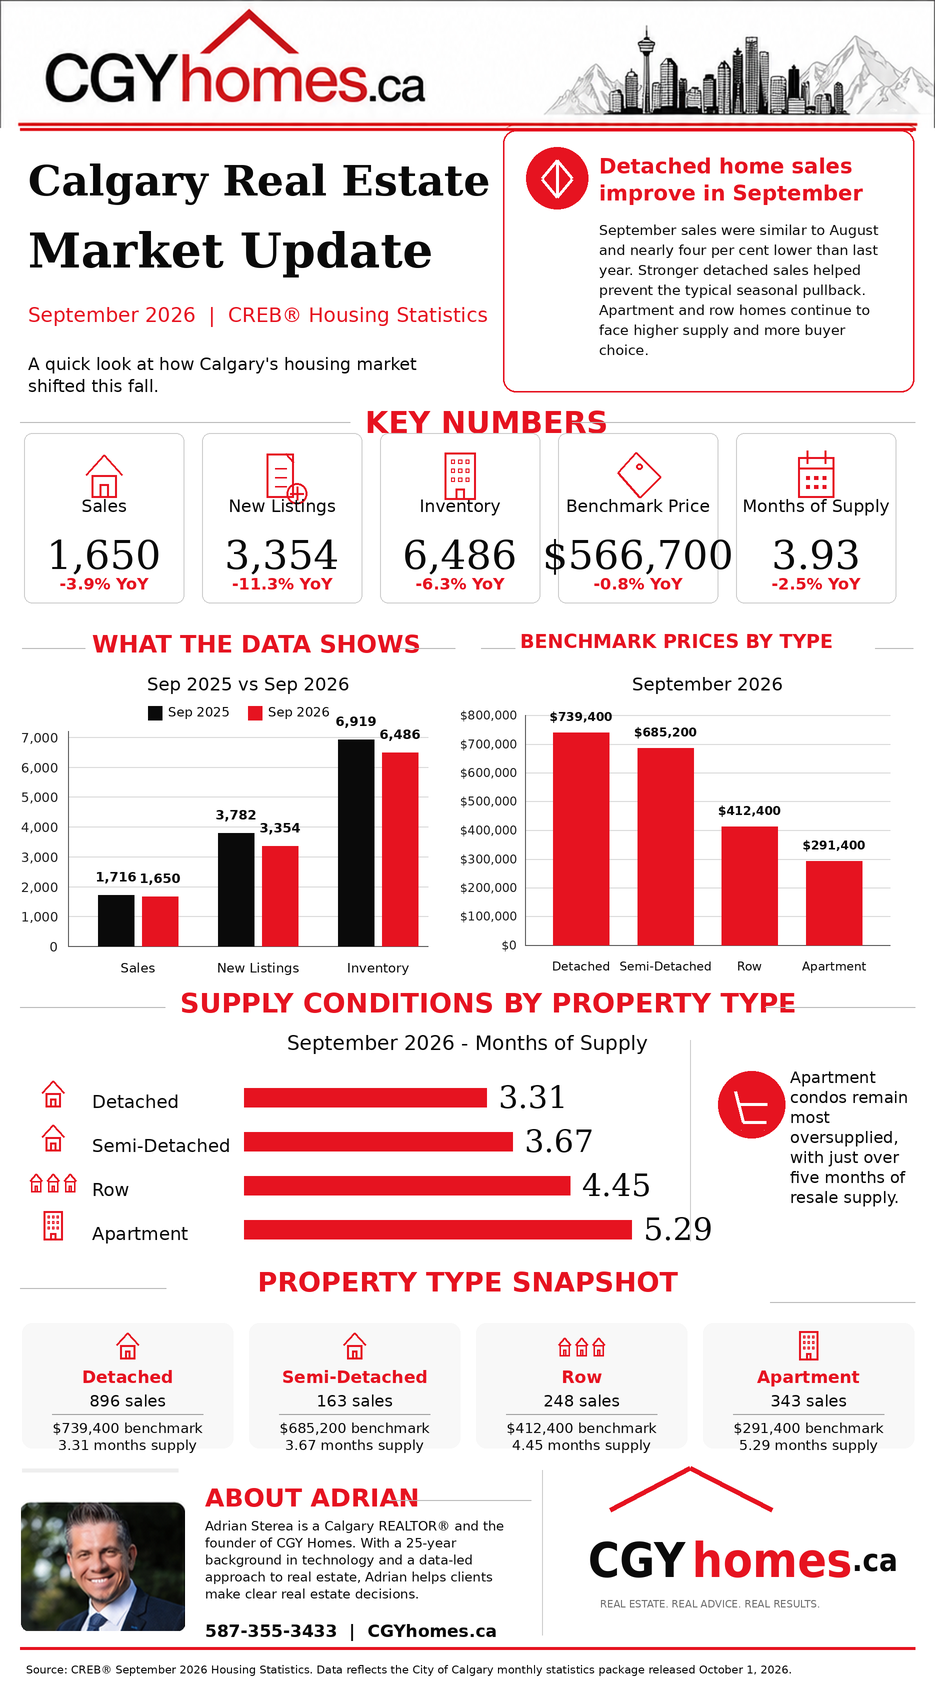
Calgary’s resale housing market held steady through September 2026. Sales were close to August levels and roughly four per cent below last September, but the more interesting movement happened on the supply side.
New listings fell 11.3% year over year to 3,354 — the sharpest decline among the headline indicators. Fewer sellers coming to market pulled inventory down to 6,486 properties, 6.3% below September 2025, and prevented the build-up of unsold supply that usually arrives with autumn.
At 3.93 months of supply the citywide market remained balanced. Stronger detached activity did most of the work in holding that line, while apartment and row homes continued to give buyers noticeably more choice.
The main story: detached strength offset a soft autumn
September usually brings a seasonal pullback. This year, stronger detached sales largely prevented it.
Detached homes accounted for 896 of the month’s 1,650 sales — more than half of all activity — at 3.31 months of supply. Semi-detached homes were close behind at 3.67 months. Both segments remain balanced, and their benchmark prices were essentially flat against last September.
Higher-density housing is where the supply sits. Apartment condominiums finished the month with 5.29 months of resale supply and a benchmark price 8.3% below September 2025. Row properties were at 4.45 months.
The citywide benchmark of $566,700 was only 0.8% below last year, the narrowest year-over-year gap in several months. That number is being held up by detached and semi-detached stability rather than by broad strength across every property type.
Calgary market at a glance
| Indicator | September 2026 | Year-over-year change |
|---|---|---|
| Sales | 1,650 | −3.9% |
| New listings | 3,354 | −11.3% |
| Inventory | 6,486 | −6.3% |
| Benchmark price | $566,700 | −0.8% |
| Months of supply | 3.93 | −2.5% |
| Sales-to-new-listings ratio | 49.19% | — |
| Average days on market | 44 days | 42 days in September 2025 |
Benchmark prices and supply by property type
| Property type | September sales | Benchmark price | Months of supply | Year-over-year benchmark-price change |
|---|---|---|---|---|
| Detached | 896 | $739,400 | 3.31 | −0.95% |
| Semi-detached | 163 | $685,200 | 3.67 | +0.09% |
| Row and townhouse | 248 | $412,400 | 4.45 | −5.54% |
| Apartment condominium | 343 | $291,400 | 5.29 | −8.28% |
Detached homes recorded 896 sales at 3.31 months of supply, with a citywide benchmark price of $739,400 — approximately 1.0% below September 2025.
Semi-detached properties had 3.67 months of supply and a $685,200 benchmark price, effectively unchanged year over year.
Row properties had 4.45 months of supply. Continued competition contributed to a $412,400 benchmark price, approximately 5.5% below the previous year.
Apartment condominiums remained the most competitive segment for sellers. The $291,400 benchmark was approximately 8.3% below September 2025, with 5.29 months of supply — just over five months of resale inventory.
What this means for Calgary buyers
The buying experience now depends heavily on which segment you are shopping in.
In apartment and row homes, buyers have real leverage: more alternatives, more time to review condominium documents and arrange inspections, and more room to negotiate on price and conditions.
Detached homes are a different market. With supply down and sales holding up, well-priced detached listings in desirable communities can still move quickly. Buyers in that segment should be prepared to act decisively on the right property rather than assuming the citywide numbers apply to it.
The practical step is to look at inventory, recent comparable sales and days on market for the specific community and property type — not the citywide average.
What this means for Calgary sellers
The drop in new listings cuts both ways.
If you are selling a detached or semi-detached home, you are facing less direct competition than a seller did a year ago. That is a genuine advantage, provided the price reflects current conditions rather than the 2022–2023 peak.
If you are selling an apartment or row home, the picture is tougher. Buyers have five months of alternatives to compare against yours. Pricing, condition, presentation and marketing exposure determine whether your listing is the one that sells or the one that sits while others transact.
In either case, the citywide benchmark is a market indicator, not an estimate of an individual property’s value.
Adrian’s market perspective
The September figures reinforce something that has been true all year: Calgary is not one market.
A detached home in a low-supply northwest community and a downtown apartment are operating under different conditions, with different levels of competition and different pricing pressure. Averaging them together produces a number that describes neither.
The sharp fall in new listings is the detail worth watching into the fourth quarter. If sellers continue to hold back while sales stay near current levels, inventory keeps tightening — which would support prices in the detached segment even with overall sales below last year.
Before a buying or selling decision, the analysis that actually helps is a neighbourhood-level comparison of recent sales and active competition for a similar property.
Thinking about buying or selling in Calgary?
Receive a personalized market analysis based on your property type, community and current competition.
Frequently asked questions
Is Calgary currently a buyer’s or seller’s market?
Calgary’s overall resale market stayed broadly balanced in September 2026 at 3.93 months of supply. Detached and semi-detached homes were the tightest segments, row properties leaned slightly toward buyers, and apartment condominiums were clearly buyer-favouring at 5.29 months.
What was Calgary’s benchmark home price in September 2026?
The total residential benchmark price was $566,700, approximately 0.8% below September 2025. That is the smallest year-over-year decline recorded in several months.
Which Calgary property type had the most supply?
Apartment condominiums had the most supply, at 5.29 months. Row properties had 4.45 months, semi-detached homes had 3.67 months and detached homes had 3.31 months.
Why did new listings fall so sharply in September 2026?
New listings totalled 3,354, approximately 11.3% below September 2025 and the largest year-over-year drop among the headline indicators. Fewer sellers listing helped pull inventory down 6.3% and prevented the usual autumn build-up of unsold supply.
Are Calgary detached-home prices falling?
The citywide detached benchmark price was $739,400, approximately 1.0% below September 2025 — close to flat. Results still vary considerably by district, price range and property condition.
How much is my Calgary home worth?
A citywide benchmark cannot determine an individual home’s market value. A property-specific analysis should consider the community, property type, size, condition, renovations, lot, parking, recent comparable sales and active competing listings.
Source: CREB® September 2026 City of Calgary Monthly Statistics Package, released October 1, 2026. Month-by-month figures and district detail are available on the Calgary housing market dashboard.
Statistics represent aggregate City of Calgary resale activity and are provided for general information. They are not an appraisal or a valuation of any individual property. Market conditions can vary considerably by community, district, property type and price range.